
Pie Chart
Pie Chart: Overview
This Topic covers sub-topics such as Pie Chart, Advantages of Pie Charts, Disadvantage of Pie Chart, Understanding Pie Charts with Values in Percentages / Fractions and, Drawing Pie Charts with Given Data in Absolute Numbers
Important Questions on Pie Chart
The size of the circle can be made proportional to the total quantity using a pie chart.
A pie chart is used to display relative proportions of multiple classes of data.
It is easy to summarise a large dataset in visual form using a pie chart.
Is pie chart visually simpler than the other type of graphs? Explain.
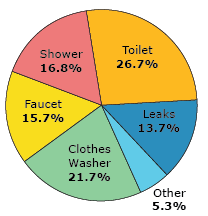
The pie chart shows percentage the water used in a household on a Sunday. Identify one disadvantage of the pie chart.
Many pie charts may be needed to show changes over time.
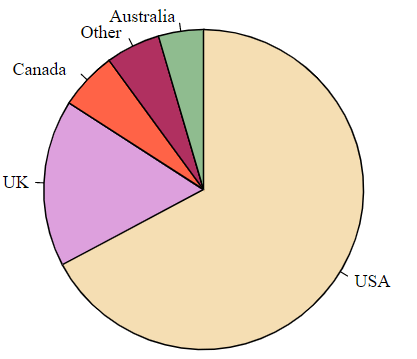
The pie chart shows populations of English native speakers. Identify one disadvantage of the pie chart.
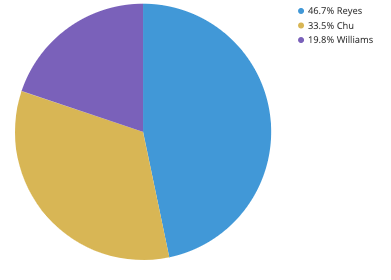
The pie chart shows the percentage of earning of three members of a family. Their total earning in a month is . Identify one disadvantage of the pie chart.
In a company there are workers of different religions. The data of the different religion are given below:
| Religion | Number of workers |
| Hindu | |
| Muslim | |
| Sikh | |
| Christian |
Represent the above data by a pie graph in degrees.
Various modes of transport used by students in a given school are given below
| Mode of transport | Number of students |
| School bus | |
| Private bus | |
| Bicycle | |
| Rickshaw | |
| on foot |
Represent the above data by a pie graph in degrees.
Draw a pie chart of the data in degrees given below.
The time spent by a child during a day:
| Activity | Time spent |
| Sleep | hours |
| School | hours |
| Home-work | hours |
| Play | hours |
| others | hours |
There are children in RMM High School. of them went for a picnic. of them went for a visit to the museum. The remaining didn’t go anywhere. Then, the number of children went for the picnic is _____.
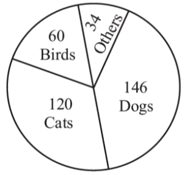
This circle graph shows pets of Rose dale Pet Show. Observe the graph and if the total percentage of cats is , find the value of . (Write the answer up to 2 decimal places)
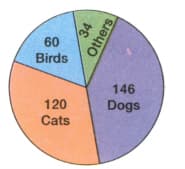
This circle graph shows pets of Rose dale Pet Show. From the graph, find how many more dogs are there than half the pets?
The pie chart shows the number of students who drank water, milk, juices and soft drinks. Observe the graph.
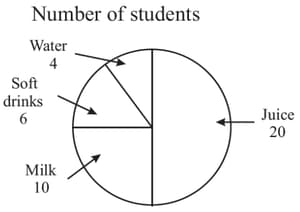
How many students are shown in all?
This pie chart shows the favourite fruits of all students of Ratan International School. Observe the chart and answer the questions.
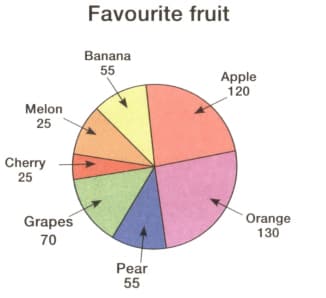
Was apple more or less popular than banana and pear together? By how many votes?
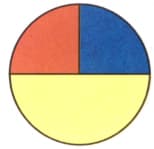
label the circle graph and answer the questions.
There are children in RMM High School. of them went for a picnic. of them went for a visit to the museum. The remaining didn’t go anywhere.
How many children went for the picnic and to the museum in all?
There are children in RMM High School. of them went for a picnic. of them went for a visit to the museum. The remaining didn’t go anywhere. How many children didn’t go anywhere?


